Aggregate
The aggregate stage calculates aggregation functions (e.g., mean, percent, freq, and more) on the input records and returns a consolidated set of records (in total and/or by comparison groups).
- Jump to Examples below
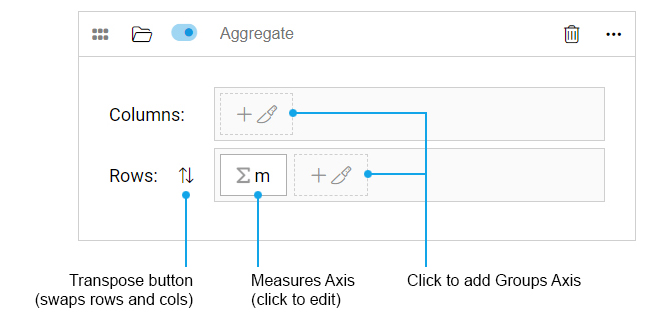
Stage Editor UI
Stage as JSON
Example:
{
    // note: there must exist one (and only one) measures axis, located in either rows or cols

    cols: [] // array of axes
    rows: [ // array of axes
        {
            "name": "m",
            "type": "measures",
            "items": [
                {
                    "syntax": "pct(aware_01==1)",
                    "label": "Aware of Brand A"
                },
                {
                    "syntax": "pct(aware_02==1)",
                    "label": "Aware of Brand B"
                }
            ]
        }
    ]

}
Measures Axis
There is only one Measures Axis and it must have at least one Measure defined. In the stage UI, click the Axis button to edit measures.
Learn about the Measures Axis.
Groups Axes
The Groups Axes are optional. Measures are calculated for each group (data cut) in a Groups Axis. If multiple Groups Axes exist, a nested expansion of all groups axes is output.
Click here to learn about the Groups Axis.
Layout
Layout determines where each Axis is returned: as rows or columns, and in what order.
In the UI, you may click and drag an axis to re-order within rows or columns container, or move it into the opposite container.
Click here to learn about Layout (todo).
Examples:
Click section to expand.
Input records
Input records
| respid | q1 | seg | country | wave |
|---|---|---|---|---|
| 1 | 8 | 1 | 1 | 1 |
| 2 | 2 | 1 | 5 | 1 |
| 3 | 4 | 1 | 3 | 2 |
| 4 | 9 | 2 | 1 | 1 |
| 5 | 1 | 2 | 2 | 1 |
| ... | ... | ... | ... | ... |
| 1000 | 3 | 4 | 4 | 2 |
Example: One measure
Example: One measure and groups
Aggregation stage with groups:
- Code
{
    "cols": [

        // measures dimension:
        {
            "name": "m",
            "type": "measures",
            "items": [
                {
                    "name": "m1",
                    "syntax": "mean(q1)"
                }
            }
        }
    ],
    "rows": [

        // this is an "any" group dimension (doesn't specify exact groups):
        {
            "name": "g1",
            "type": "groups",
            "starDim": true,
            "starField": "segment"
        }
    ]
}
Output records:
| segment | m1.val | m1.n |
|---|---|---|
| 1 | 2.5 | 250 |
| 2 | 1.7 | 250 |
| 3 | 4.3 | 250 |
| 4 | 2.9 | 250 |
Example: One measure and specified groups
Aggregation stage with specified groups:
- Code
{
    "cols": [
        {
            "name": "m",
            "type": "measures",
            "items": [
                {
                    "name": "m1",
                    "syntax": "mean(q1)"
                }
            ]
        },
    ]
    "rows": [
        {
            "name": "segment",
            "type": "groups",
            "items": [
                { "syntax": "segment==1",       "label": "Segment one" },
                { "syntax": "segment==2",       "label": "Segment two" }
                { "syntax": "segment in (3,4)", "label": "Segment three or four" }
            ]
        }
    ]
}
Output records:
| segment.syntax | segment.label | m1.value | m1.n |
|---|---|---|---|
| segment==1 | Segment one | 2.5 | 250 |
| segment==2 | Segment two | 1.7 | 250 |
| segment in (3,4) | Segment three or four | 3.5 | 500 |
Example: Measures and multiple group dims
Aggregation stage more complex example
- Code
Todo: I changed the syntax. I'm just keeping this here to remember some simplification ideas
{
    measures: {
        m1: { syntax: "pct(q1 in (1,2,3))",   label: "Q1 Bottom Box" },
        m2: { syntax: "pct(q1 in (4,5,6,7))", label: "Q1 Indifferent" },
        m3: { syntax: "pct(q1 in (8,9))",     label: "Q1 Top Box" },
    },
    groups: {
        country: "country",
        segment: {
            seg1: "segment==1",
            seg2: "segment==2"
        },
        wave: {
            w1: { syntax: "wave==1", label: "Last Year" },
            w2: { syntax: "wave==2", label: "YTD" },
        }
    },
    layout: {
        cols: ["segment"],
        rows: ["country", "wave", "m"]
    }
}
Output records:
Some output fields have been hidden from the view below: "wave.id", "wave.syntax", "m.id" and "m.syntax" would also return.
| country | wave.label | m.label | seg1.val | seg1.n | seg2.val | seg2.n |
|---|---|---|---|---|---|---|
| Canada | Last Year | Q1 Bottom Box | (value) | (n) | (value) | (n) |
| Canada | Last Year | Q1 Indifferent | (value) | (n) | (value) | (n) |
| Canada | Last Year | Q1 Top Box | (value) | (n) | (value) | (n) |
| Canada | YTD | Q1 Bottom Box | (value) | (n) | (value) | (n) |
| Canada | YTD | Q1 Indifferent | (value) | (n) | (value) | (n) |
| Canada | YTD | Q1 Top Box | (value) | (n) | (value) | (n) |
| Spain | Last Year | Q1 Bottom Box | (value) | (n) | (value) | (n) |
| Spain | Last Year | Q1 Indifferent | (value) | (n) | (value) | (n) |
| Spain | Last Year | Q1 Top Box | (value) | (n) | (value) | (n) |
| Spain | YTD | Q1 Bottom Box | (value) | (n) | (value) | (n) |
| Spain | YTD | Q1 Indifferent | (value) | (n) | (value) | (n) |
| Spain | YTD | Q1 Top Box | (value) | (n) | (value) | (n) |
Full Code Reference (scratch - don't read me)
Ignore this stuff.
Stage syntax Reference
{
    "cols": <axis-list>,
    "rows": <axis-list>
}
<axis-list>
[
    <axis>,
    <axis>,
    ...
]
<axis>
{
    "name": "my-axis-name",
    "type": "measures", // measures, groups or data
    // (starDim)
    // (starField)
    "items": [
        <axis-item>,
        <axis-item>,
        <axis-item>,
        ...
    ]
]
<axis-item>
An item can be defined as a string if only the syntax is needed. SHOULD I ALLOW THIS SHORT FORM??
"pct(q1==1)"
If an item needs a name, label or anything beyond syntax, an object should be used.
{
    "syntax": "pct(q1==1)",
    "label": "Satisfied",
    "valueFormat": ".1%"
    "something_else": "#0064c8"
}
Example usage:
"items": [
    "pct(q1==1)",
    {
        "name": "m2",
        "syntax": "pct(q1==2)",
        "label": "satisfied",
        "weight": "w1"
    }
]
starDim
todo
Do a mongodb $group
{
    $aggregate: {
        $groups: {
            country: "country",
            segment: "segment"
        },
        $measures: {
            avg_q1: "avg(q1)",
            avg_q2: "avg(q2)"
        }
        // layout missing, so according to rules above,
        // measures will be columns
        // stardims will be rows
        // seems pretty close to mongodb syntax
    }
}
Enhancing MongoDB group
{
    $aggregate: {
        $groups: {
            country: "country",
            segment: "segment",
            own: { // specify exact groups (overlapping, from different vars)
                own_honda: { syntax: "own_01==1", label: "Own Honda" },
                own_toyota: { syntax: "own_02==1", label: "Own Toyota" },
                own_ford: { syntax: "own_03==1", label: "Own Ford" },
            }
        },
        $measures: {
            avg_q1: "avg(q1)",
            avg_q2: "avg(q2)"
        }
        // layout missing, so according to rules above,
        // measures will be columns
        // stardims (country, segment) will be rows
        // groupdims will be cols?
    }
}
| country | segment | own_honda | own_toyota | own_ford | | country | segment | avg_q1 | avg_q2 | avg_q1 | avg_q2 | avg_q1 | avg_q2 | | ------- | ------- | ------ | ------ | ------ | ------ | ------ | ------ | | USA | Seg 1 |{val, n}|{val, n}|{val, n}|{val, n}|{val, n}|{val, n}| | USA | Seg 2 |{val, n}|{val, n}|{val, n}|{val, n}|{val, n}|{val, n}| | USA | Seg 3 |{val, n}|{val, n}|{val, n}|{val, n}|{val, n}|{val, n}| | Canada | Seg 1 |{val, n}|{val, n}|{val, n}|{val, n}|{val, n}|{val, n}| | Canada | Seg 2 |{val, n}|{val, n}|{val, n}|{val, n}|{val, n}|{val, n}| | Canada | Seg 3 |{val, n}|{val, n}|{val, n}|{val, n}|{val, n}|{val, n}|
| m | country | segment | own_honda | own_toyota | own_ford |
|---|---|---|---|---|---|
| avg_q1 | USA | Seg 1 | {val, n} | {val, n} | {val, n} |
| avg_q1 | USA | Seg 2 | {val, n} | {val, n} | {val, n} |
| avg_q1 | USA | Seg 3 | {val, n} | {val, n} | {val, n} |
| avg_q1 | Canada | Seg 1 | {val, n} | {val, n} | {val, n} |
| avg_q1 | Canada | Seg 2 | {val, n} | {val, n} | {val, n} |
| avg_q1 | Canada | Seg 3 | {val, n} | {val, n} | {val, n} |
| avg_q2 | USA | Seg 1 | {val, n} | {val, n} | {val, n} |
| avg_q2 | USA | Seg 2 | {val, n} | {val, n} | {val, n} |
| avg_q2 | USA | Seg 3 | {val, n} | {val, n} | {val, n} |
| avg_q2 | Canada | Seg 1 | {val, n} | {val, n} | {val, n} |
| avg_q2 | Canada | Seg 2 | {val, n} | {val, n} | {val, n} |
| avg_q2 | Canada | Seg 3 | {val, n} | {val, n} | {val, n} |